Daily MHD-IPS tomography maps
plots made:
Tue Oct 11 19:54:12 UTC 2022 (Tue Oct 11 12:54:12 PDT 2022)


num of IPS LoS data used:
2
Latitude-longitude maps at 50Rs and about 1AU

mpeg movie of recent 27-day plots. mp4 movie (2020, year to date: not regularly updated) yearly mp4 movie files: year, 2012, 2013, 2014, 2015, 2016, 2017, 2018. 2019. |
Solar wind variables at the position of the Earth
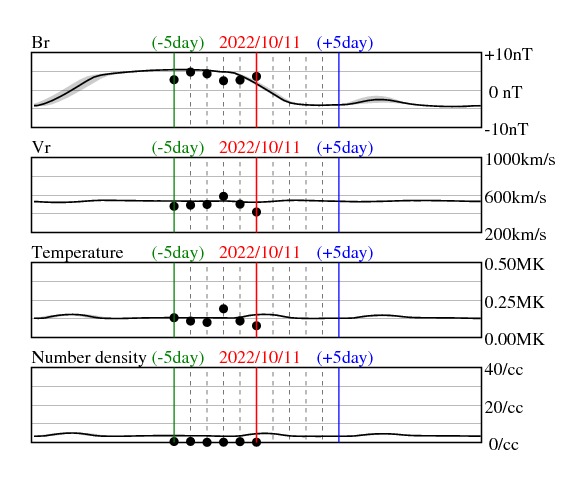
(*) Black thick lines show the simulated values at the position of the Earth.
Gray shadow bands around the thick black lines represent uncertainty that is here calculated as the maximum and minimum values of the variables in a volume within 5 solar radii from the Earth.
Black dots are for the daily-averaged ACE measurement.
mpeg movie of recent 27-day plots.
mp4 movie (2020, year to date: not regularly updated) yearly mp4 movie files: year 2012, 2013, 2014, 2015, 2016, 2017, 2018. 2019. |