Credit: The SDO/HMI Team, Stanford University.
Graphics follow description.
Start with 8 April full disk continuum, about 20 seconds. This shows the Sun in white light (shown here in false color to enhance contrast) at the time of the Coronal Mass Ejection seen in the AIA data. The small "pore" (a tiny sunspot without a penumbra) near the center east-west, and half way to top from equator, disappears at about the same time as the CME in AIA. Note that a lot may be happening in the corona without any very noticable change in the continuum (white light).
Switch to March 29 where a larger active region was near disk center. This sequence shows continuum data for about 6 hours from 8 to 14 UT on 29 March. It starts with the full disk view then zooms to the region of interest. The flicker is granulation and oscillations.
The magnetic field in the same region can also be examined with HMI. the next segment shows a similar view for the same interval but this time in magnetic field. lighter shading is magnetic field directed toward the observer and darker is field away, or into the Sun at the center. Note the small rapid changes in the penumbra and near the spots.
The same region without the zoom.
The same region without the zoom but tracked to remove solar rotation.
HMI measures the motion of the photosphere using the Doppler effect. We call this data "Dopplergrams". Here is a sequence of Dopplergrams for 2 hours and 7.5 minutes starting at about 8 UT, 29 MArch 2010. Here is a smaller format version and the full HD version of this sequence. It is perhaps best viewed on loop mode. Light color is motion away from the observer, darker is motion toward the observer.
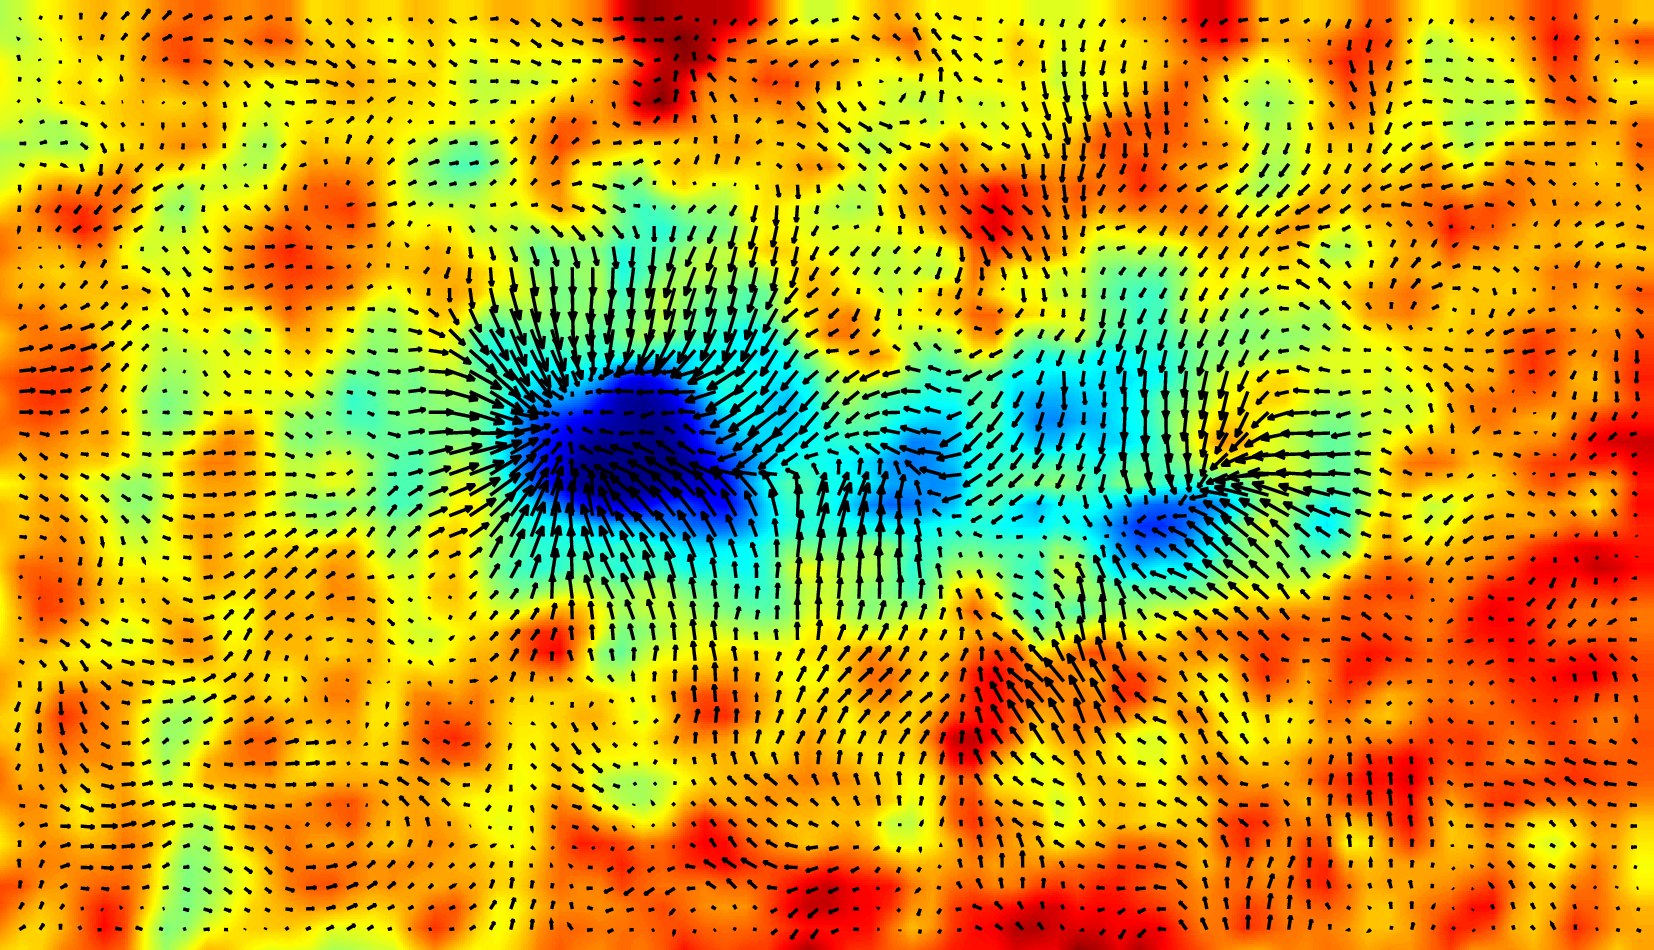
Doppler data for the same region has been used in a first test of the Time-Distance heliosiesmology analysis of HMI data. The background image shows sound-speed preturbation, with warm color as positive and cold color as negative. The range of sound-speed perturbation is from -4.0% to +1.5%. The arrows show flow fields, with the longest arrow representing a speed of approximately 600m/s. The results are from an average of 0 - 1 Mm in depth, and from 22:09UT - 06:08UT of Mar 29, 2010.