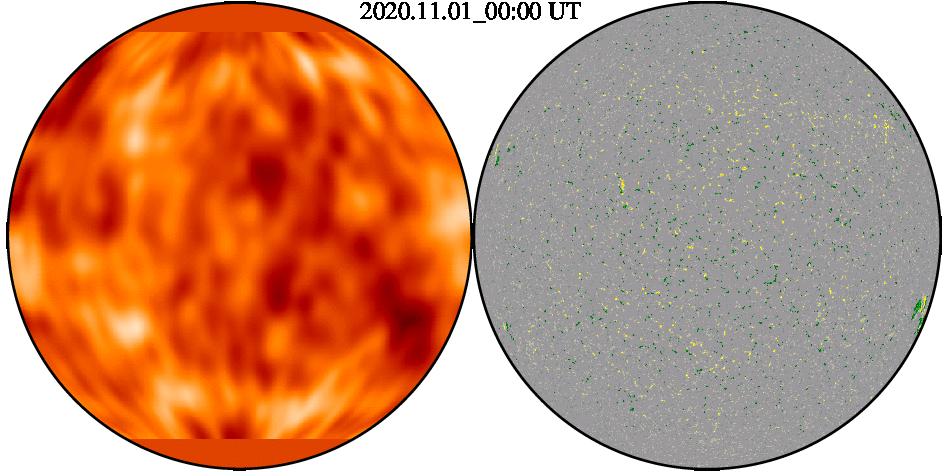
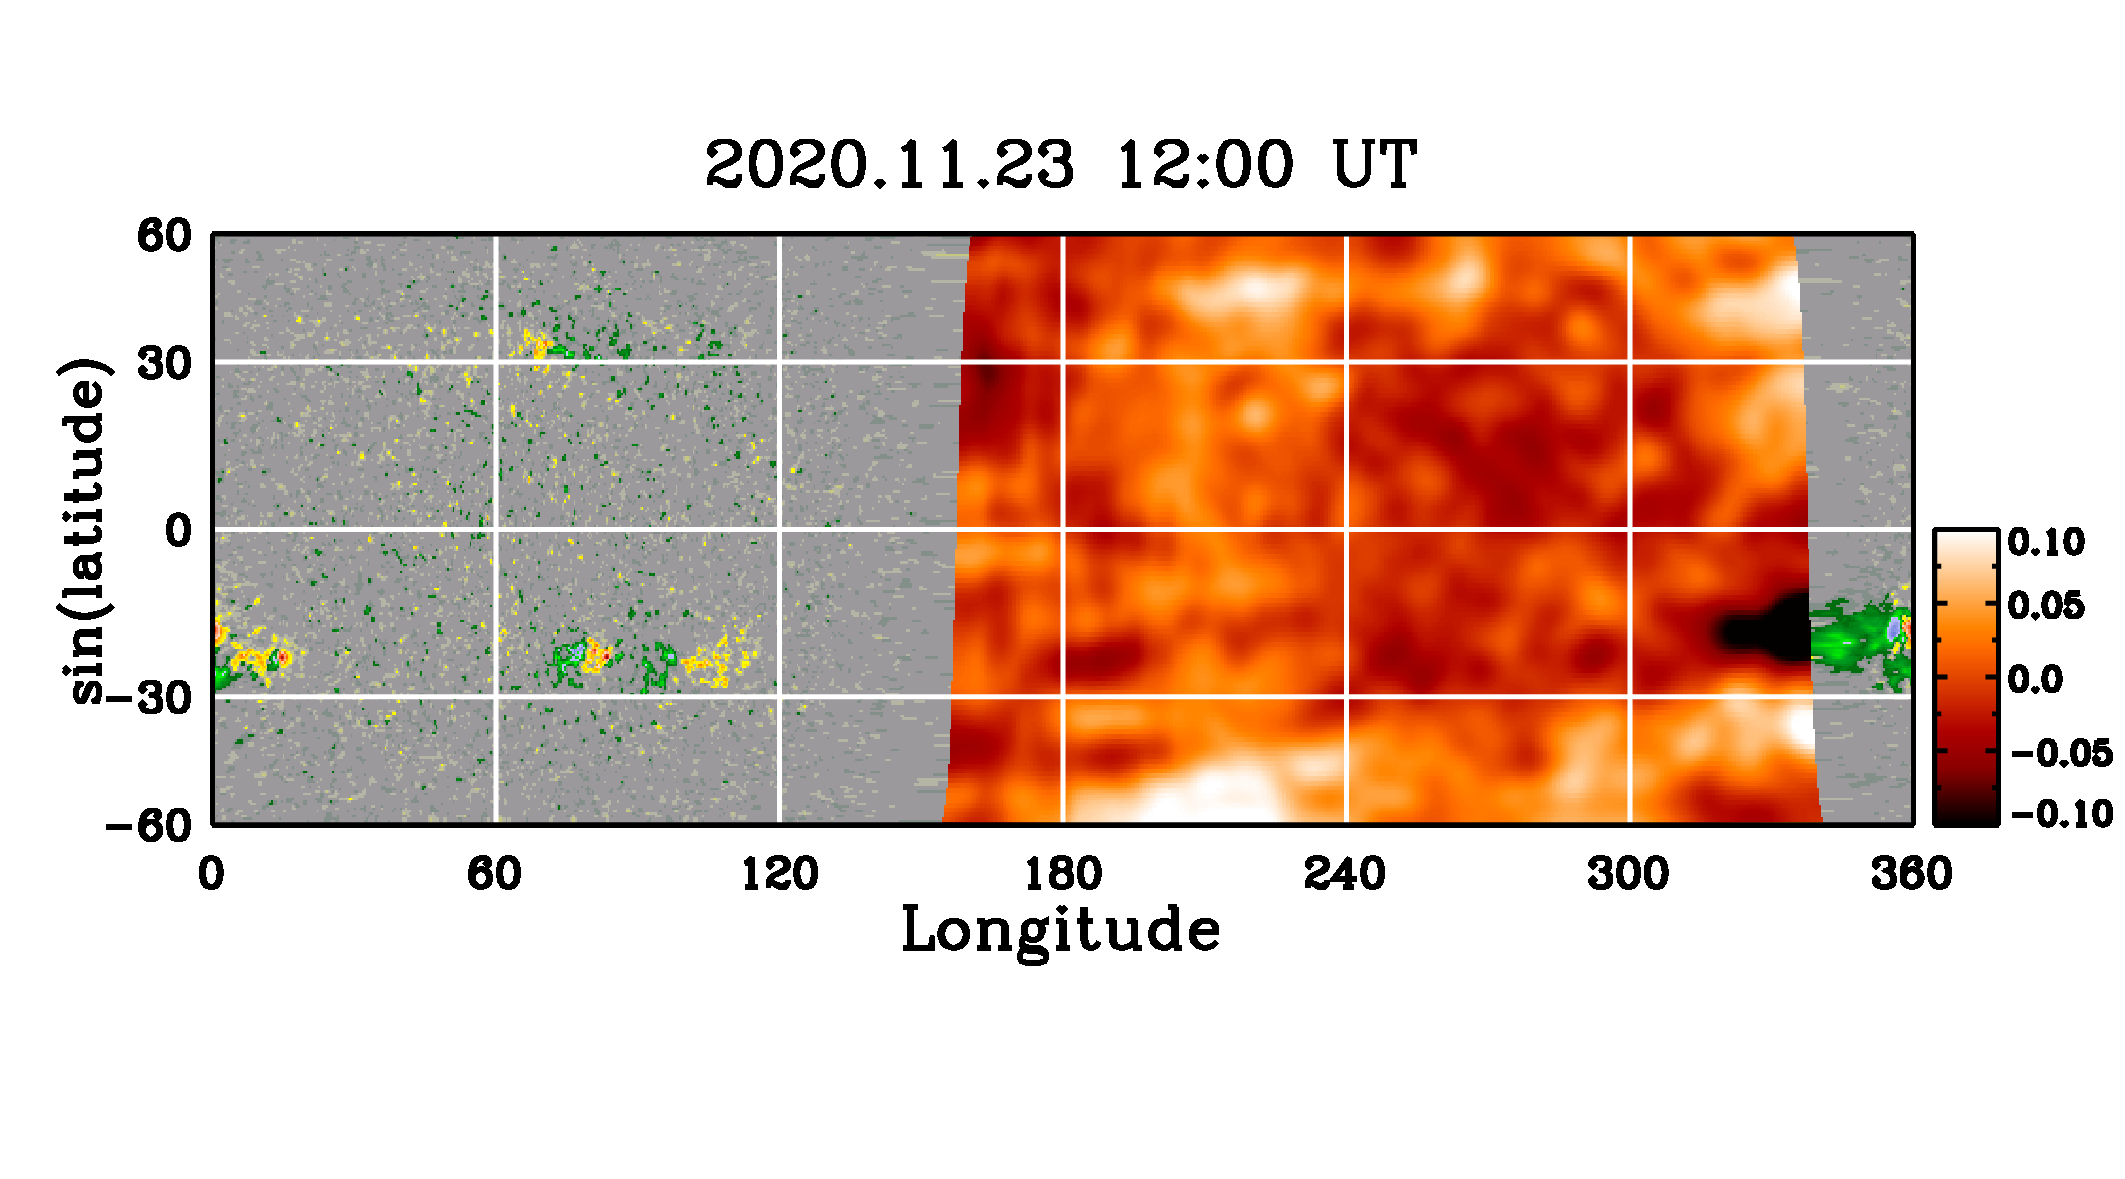
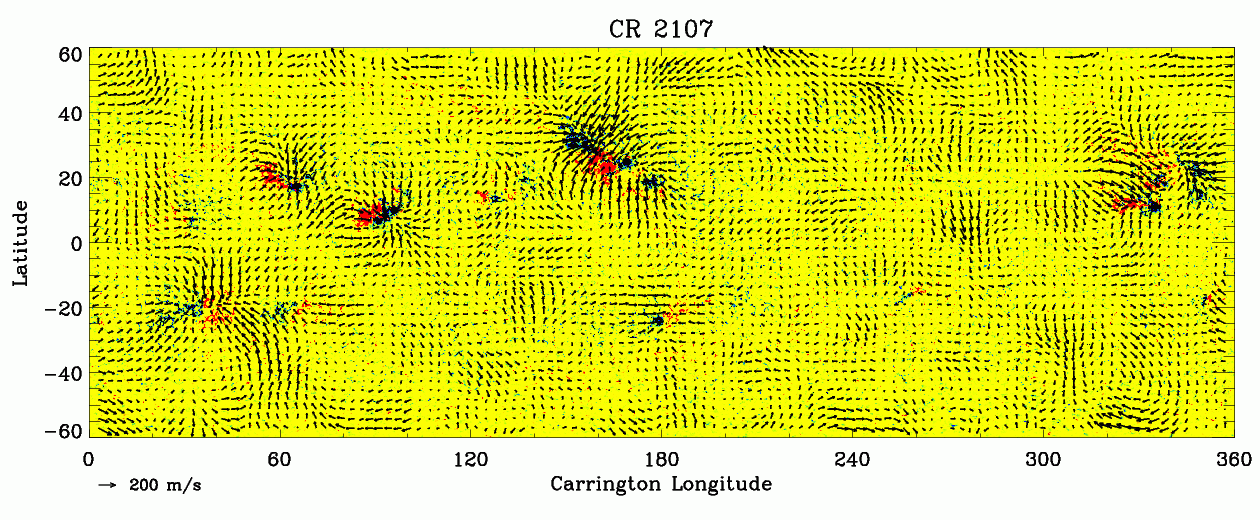
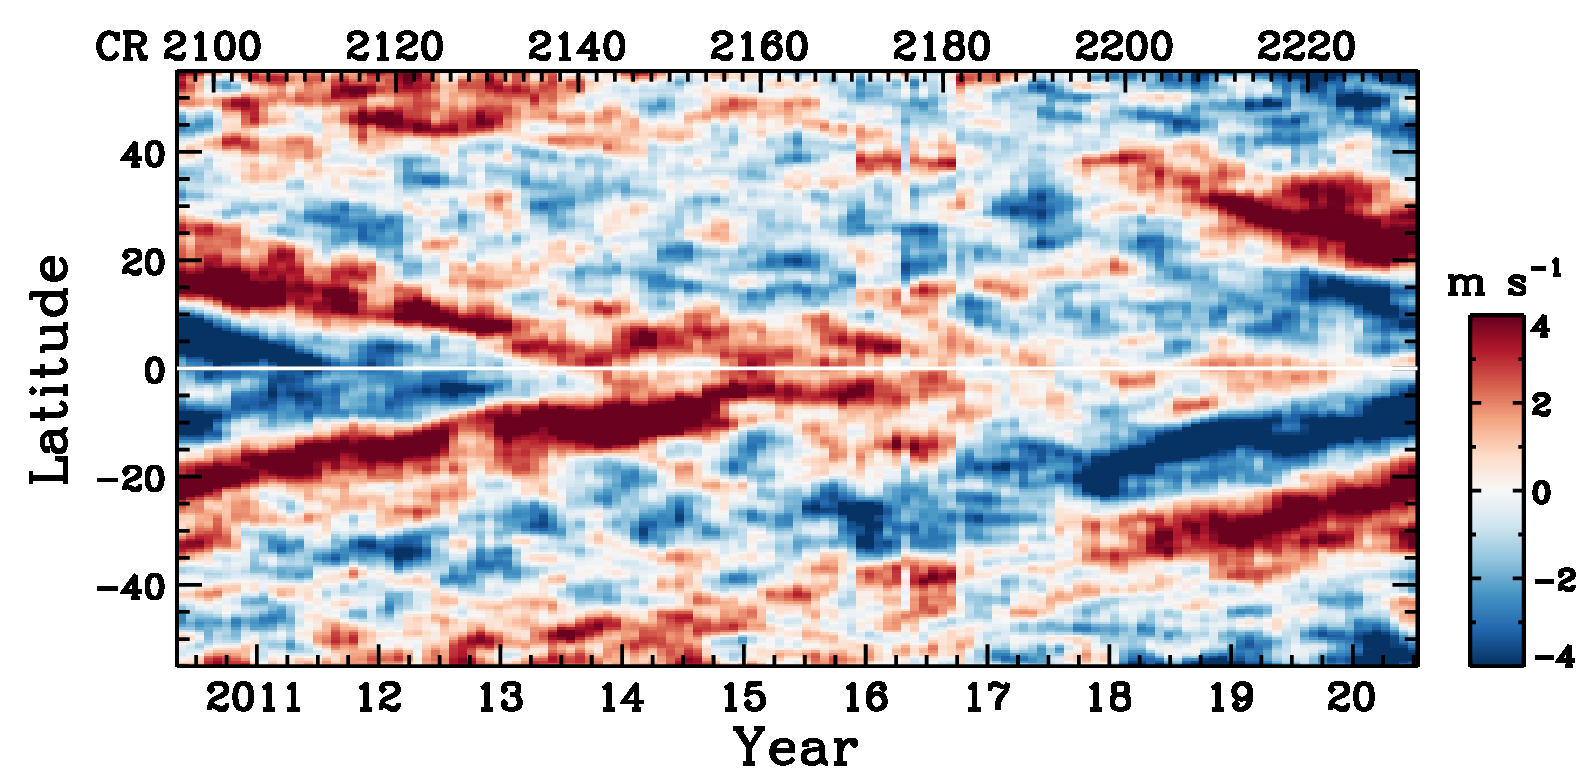
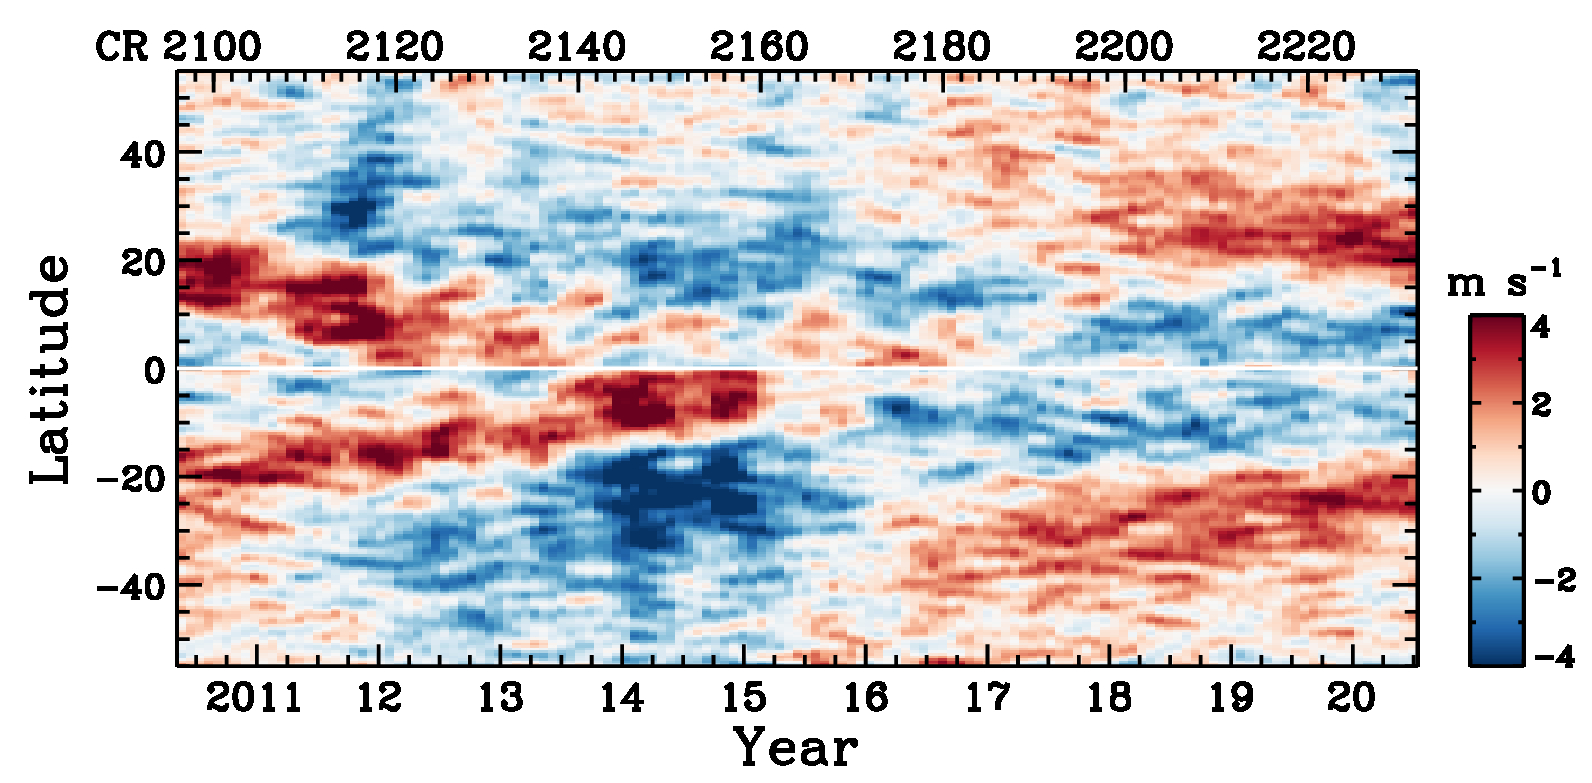
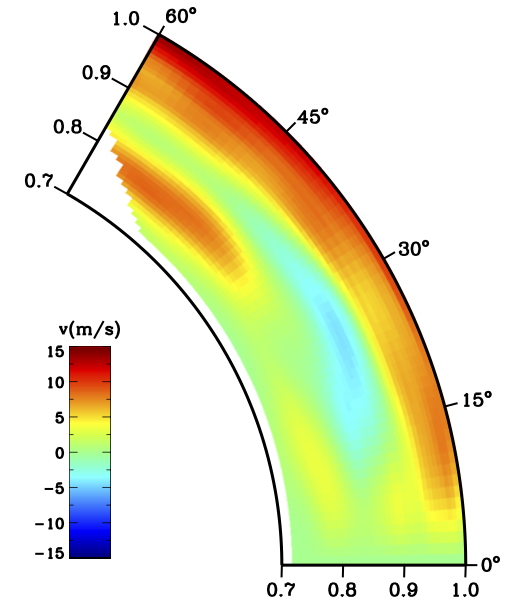
Time-Distance Helioseismic Far-Side Imaging

Fits Data Access Past Images

Shown below are the Sun's near-side magnetic field (grey background with green/yellow areas highlighting strong magnetic field) and far-side images of acoustic travel-time shifts (red/orange background with dark patches highlighting active regions). The synchronic image shows the most recent image, and the movie of the near- and far-side hemispheres shows time-lapse of the last 30 days. The far-side acoustic images are obtained every 12 hours using 31-hour continuous near-side Doppler-velocity observations. The images shown in this page are first-look results using the HMI's NRT data, and calibrated results are typically available 6 days later. Please refer to this paper for details of the method and reliability of the results.


Time-Distance Subsurface Flows

full-disk flow maps synoptic flow maps

HMI time-distance helioseismic data-analysis pipeline generates the Sun's near-full-disk flow field, covering 120°×120° area with a depth from 0 - 20 Mm. These results are available every 8 hours, typically two weeks behind real time. Shown on the right is the most recent map of supergranulation, represented by the divergence of the horizontal flow field. Shown below is a large-scale synoptic flow map (arrows) for the most recent Carrington rotation with magnetic field background. The systematic center-to-limb effect is removed from these data to our best knowledge. One also needs to be cautioned that results in and near active regions may be affected by the magnetic field, and the users are urged to consult the authors of this data product if they plan to use these data for studies involving flows of such areas. Please refer to this paper for details of the method and error estimates.


Long-Term Evolution of Near-surface Rotation and Meridional Flow

Data Access

For each Carrington rotation, the near-full-disk subsurface flow maps can be averaged for the Sun's differential rotation and meridional flow at various depths of 0 - 20 Mm. Shown below are the temporal evolution of the torsional oscillation and residual meridional flow after long-term mean profiles of rotation and meridional flow are subtracted from the respective profiles for each Carrington rotation, covering the period from May 2010 to the most recent Carrington rotation. In the torsional oscillation plot, positive (negative) speed is faster (slower) than the mean flow. In the residual meridional flow plot, positive (negative) speed is pole-ward (equator-ward). Data with and without the mean flows are both available for downloading. Please refer to this paper for details of data reduction.

Torsional Oscillation

Residual Meridional Flow


Deep Meridional Circulation

The Sun's interior meridional circulation can be inverted from time-distance travel-time-shift measurements, after the systematic center-to-limb effect and surface magnetic effect are removed. Shown left is a hemisphere-symmetrized meridional circulation profile, obtained through disentangling the center-to-limb effect and the flow-induced signals from all across-the-disk measurements. Please refer to this paper for details.


Get in Touch

junwei at sun.stanford.edu