Michael Turmon, JPL, October 2011
This brief note explains the format of HARP movies, which are output from the HARP active region tracker. The movies can give you a quick overview of a region's extent and evolution.
This note explains the color coding of pixels, and the layout of text overlays.
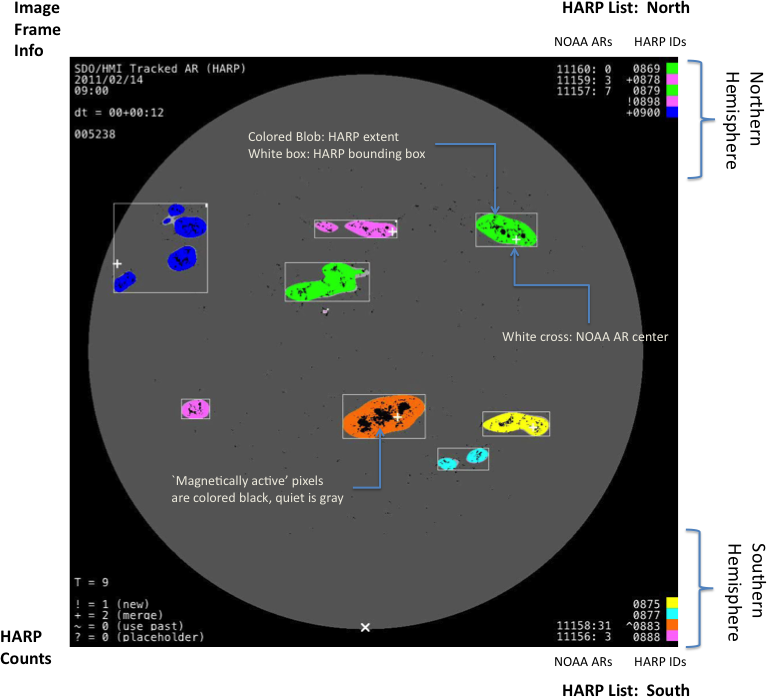
Here is a still image illustrating this information.
The movies have 1024x1080 frames; they are have been reduced by 4x in each direction from the 4096x4096 originals by simple subsampling. The disk is gray, and pixels labeled as "active" within the gray disk are black.
The colored blobs, which we call patches when we're referring to just a single image, represent the full content of various HARPs in that image. Small clumps of black pixels that you can see outside the HARPs are not concentrated enough to combine into a HARP.
The color of the patch is related to its HARP ID. By numerical coincidence, sometimes two HARPs have nearly the same color, as with 869 and 879 in the image here. The white bounding box surrounding the patch encircles all within-HARP pixels, so you can tell HARPs apart even if they happen to have the same color.
Note, the HARP is defined to be the content of the colored patches within the bounding box, not the bounding box itself.
Each corner holds text overlays. The upper left corner has information about the specific image, the lower left corner has HARP counts within the image, and the right corners hold active region lists for HARPs and NOAA ARs.
Below is the same image, with further annotations.
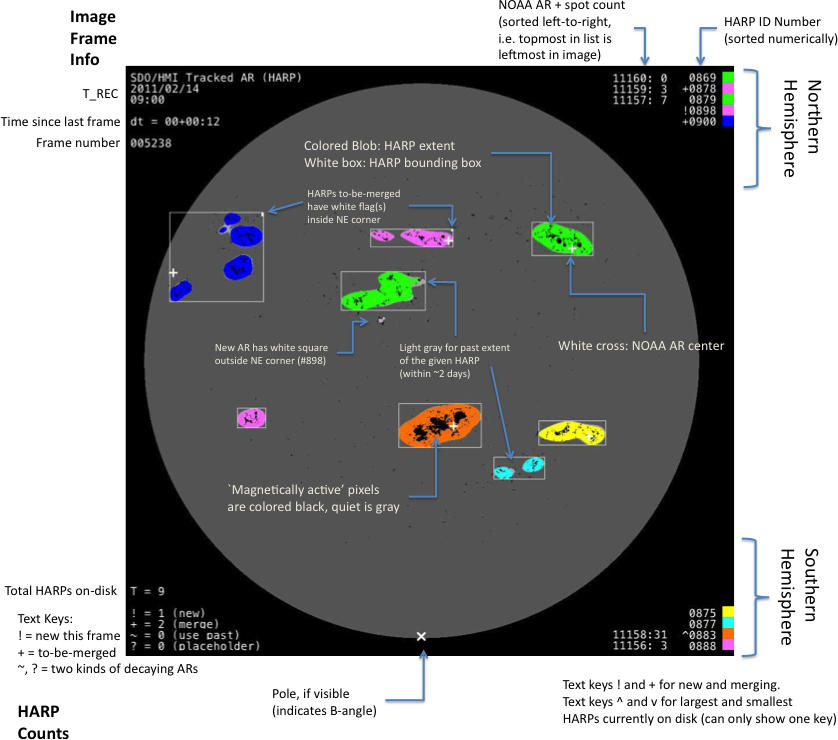
Sometimes, as in the blue patch here (HARP 900),
the white bounding box encloses several unconnected areas separated
by quiet Sun.
This happens when, at a later time, additional flux emerged, and
these areas were merged.
A small white square hangs inside the upper-right corner of the
white bounding box to remind us that these areas will be
merged in a later image.
If more than one separated area will be merged,
the height of the white indicator
lengthens proportionally.
In the image here, HARP 900 will be merged at least twice more, and HARP 878 will be merged once more in future frames.
Regions that are new in this frame are shown with a white square hanging outside the corner of the white bounding box.
Sometimes the white bounding box is dotted. This means that the corresponding HARP was not seen in that frame, but is being retained in case it reappears. This is called a "placeholder" region and happens, rarely, for highly decayed ARs.
Outlines of past appearances of each HARP are also shown. These outlines are propagated forward in time using standard differential rotation profiles, and are shown in the image overlay in light gray, barely distinguishable from quiet sun. They are especially visible in rapidly shrinking regions; in other regions they may appear as a thin light gray band. The outlines are made to slowly decay over a roughly 1-2 day time scale; that is, a light gray pixel will only persist for 1-2 days unless the same site is again found to be active.
All four corners of the movie have text insets.
Top left: Shows time and date of T_REC for this image,
time difference since the prior image
(in dt = DD+HH:MM format, typically 00+00:12 for
720s cadence imagery), and frame number in overall image sequence.
Bottom left: Total number of HARPs in this frame, plus counts of special HARPs: new HARPs (rare), to-be-merged HARPs, and two types of HARPs which were found in the past, but not in this image ("past" and "placeholder" patches).
Top right: For the northern hemisphere, shows the HARP ID of the current region sets, sorted from lowest to highest HARP ID. A "^" next to the ID means it is the largest on the disk, and a "v" means it is the smallest. A "!" means it is new. A "+" means it will later be merged. Only one character can be displayed at a time, so if something is both to-be-merged (+) and biggest (^), only "^" is shown.
These indicators can help to disambiguate cases where the color-coding is ambiguous.
Also, the NOAA AR numbers are listed. Each number corresponds to a white cross on the image overlay. To make it easy to determine the correspondence, the NOAA numbers shown are sorted from left-to-right by the position of the corresponding AR (white cross) in the image, in pixel coordinates. Thus, the top NOAA number is the leftmost cross.
Note, the ordering is not by longitude, but by column in the image, so your eye can easily tell the ordering. The associated spot count (proxy for "importance") is after the NOAA AR number.
The positions of NOAA ARs are shown as white crosses on the disk. These positions are only supplied once per day (nominally at 24:00 UT), so for other times, positions are linearly interpolated in lat/lon coordinates. Occasionally, the positions change too fast to be consistent with solar rotation.
NOAA ARs can appear to hover near the limb because only the visible content is taken in to account when computing the center. Also, there is a pause in motion of six hours that occurs before the start and after the end of the lifetime of each NOAA region, due to the lack of any data beyond the endpoints to use in interpolation. That is, if the region first appeared in the NOAA catalog at 24:00 UT on February 14, it would appear as a stationary white cross between 18:00 UT and 24:00 UT, after which it would drift westward as expected.