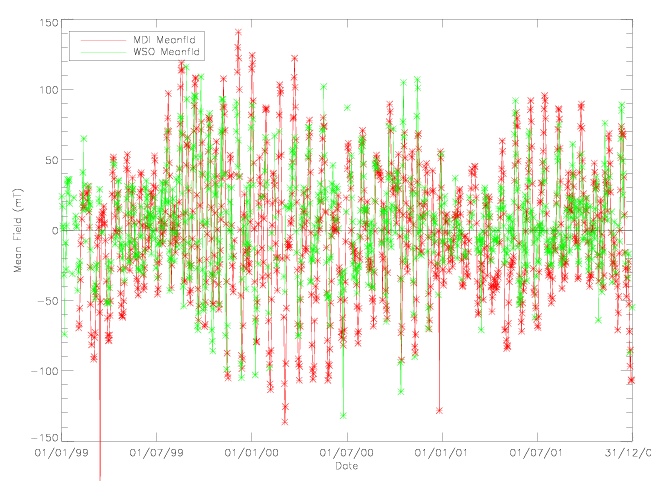
 Figure 1 (Image is .gif)
WSO had some equipment failures between Nov 2000 and July 2001 that produced to incorrect field values for parts of that interval. To re-calibrate those data, we use the correspending magnetograms taken by SOHO/MDI to simulate process of WSO magscan observation, and compare them with real WSO magnetograms. This comparison suggests that a re-scaling factor 2 is needed to re-calibrate those questionable WSO magnetograms.
Figure 1: Mean fields from WSO (green line) and MDI (red line) in the period from Jan. 1999 to Dec. 2001. Offset in MDI magnetograms is corrected. The mean field from WSO is significantly smaller than that from MDI between Nov 2000 and July 2001.
 Figure 2a (Image is .gif)
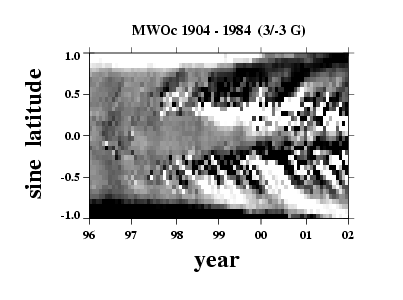
 Figure 2b (Image is .gif)
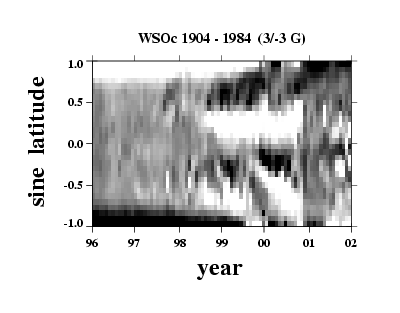
 Figure 2c (Image is .gif)
Figure 2. Butterfly plots of NSO (a), MWO (b) and WSO (c) for the interval 1996-2001 derived by Yi-Ming Wang. Agreement of WSO with NSO and MWO is quite poor between Nov 2000 and July 2001.
Figure 3: MDI measurement vs WSO measurement when the 3min aperture is at solar disk center. The lines are linear fitting of MDI and WSO measurements. The red denotes the measurement between Jan. 1999 and Aug. 2000 when the equipment was probably fine; the green represents the measurement in the period from Jan. 2001 to May 2001 when there were a series of problems with phototubes and electronics in the equipment ( WSO values are enlarged to multiply a factor 2 here); the blue is the measurement between Sep. 2001 and Dec. 2001 in which the equipment was fixed.
Figure 4: The same as in Figure 3. We rebin the samples according to MDI observation to avoid large weight in low values that would influence the linear fitting between WSO and MDI. Again, WSO values between Jan. 2001 and May 2001 are enlarged to multiply 2.
Figure 5: Error estimate of Figure 4. The dot lines show 95% confidence bands.
Figure 6: Linear fittings of monthly WSO and MDI measurement between Sep. 2000 and Aug. 2001. The slope of Dec. 2000 dramatically drops. It seems to be recovered in June 2001.
Figure 7: Slopes of linear fitting of monthly WSO and MDI measurement between Jan. 1999 and Dec. 2001. ( need to check low values of slopes in 03/00, 05/00, 07/00, and 08/01, 09/01, 12/01. probably there are several bad data in those months. haven't rebin-ed the samples so individual sample may influence the linear fitting if that value is really bad.)
Offsets of linear fitting of monthly WSO and MDI measurement between Jan. 1999 and Dec. 2001.