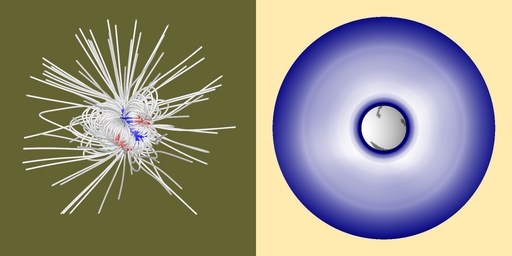
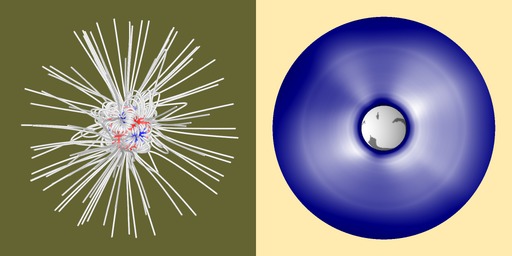
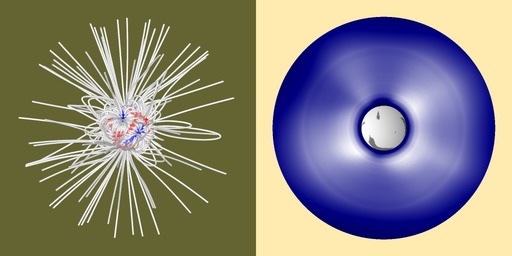
Prediction of the solar corona on March 9, 2016.
With low-resolution Daily-update MHD simulations
From daily-updated MHD simulations, we can make several types of plot that can be compared with the actual eclipses seen from the ground.
Here we are making plots of coronal magnetic field, base of open field regions (coronal holes) and brightness of coronal streamers, from the position of the Earth on March 9, 2016.
These plots will be generated around 1PM PST everyday immediately after our daily coronal MHD simulation is completed.

movie (predictions made from Feb. 16 to March 4)
Coronal brightness plotted here is plasma density (multiplied by apparent size of the Sun seen from each point) integrated along line of sight in three-dimensional data from near-real-time MHD simulation, and normalized with Newkirk filter function.
With medium-resolution MHD simulation
MHD simulations started with the solar-surface magnetic field map for the day three weeks (one week) before
often yield shapes of coronal streamers at the East (West) limb better matching observations.
Plots below show results from the simulations with moderately high-spatial resolution using the synoptic map data on 2016 Feb. 17 and March 3 (about 3 weeks and 1 week before the TSE, respectively).
This moderate-resolution simulation was started with initial potential magnetic field calculated through 7th-order spherical harmonics polynomials (* 5th-order one for daily low-resolution simulations).

with the daily-updated synoptic map for 2016 March 3

with the daily-updated synoptic map made on 2016 Feb. 17
Last update (text) : 2016 March 4.
.
Daily updates started on 2016 Feb. 15.
K. Hayashi


