Prediction of the solar corona on July 2, 2019.
Prediction with low-resolution Daily-update MHD simulations
From daily-updated MHD simulations, we can make several types of prediction that can be compared with the actual eclipses seen from the ground.
One daily simulation with 0.15 million grids takes usually two hours on an 8-core node.
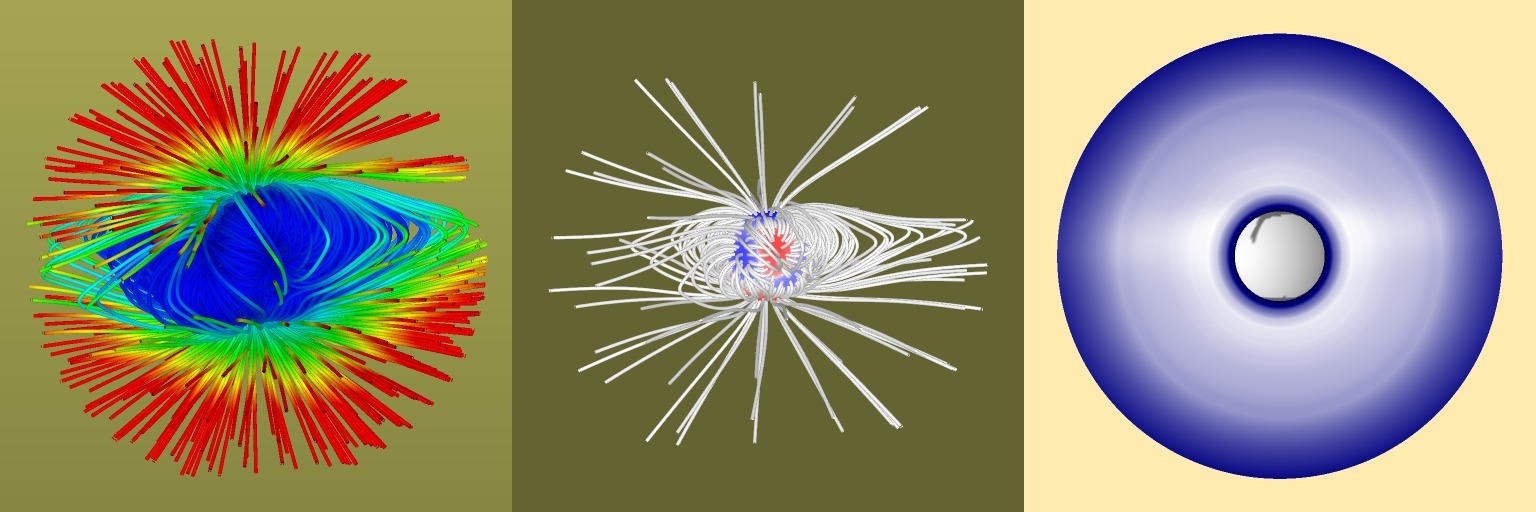
In the figure below, from left to right,
coronal magnetic field lines colored with plasma speed (within 2.5 Rs),
field lines (within 5 Rs) and photospheric magnetic field,
base of open-field regions (coronal holes) and brightness of coronal streamers are shown.
(click here to enlarge, or
get an mpeg movie combining daily-simulation plots from 2019 June 18)

Left: Magnetic field lines with colors representing local solar wind speed
(blue for 5km/s or less, green for 50km/s, and red for 100 km/s), within 3.5 solar radii.
Middle: Coronal magnetic field lines within 5 solar radii.
Right: Coronal plasma density normalized with an approximate Newkirk filter fucntion (out of the solar disk)
and solar-surface positions of open-field regions (on the disk).
The view point is set at the position of the Earth on July 2, 2019 (approximately CR2219, 320 degrees Carrington longitude, and 3 degrees north from solar equator), and the solar North is up.
These plots are updated regularly and daily around 11:30AM PST, immediately after the daily coronal MHD simulation is completed.
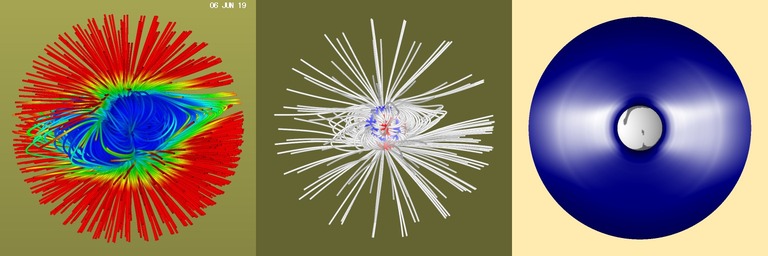
Prediction with a moderate-resolution MHD simulation
Belows are predictions and visualizations from a moderate-resolution (with about half million grids) MHD simulation
of solar corona using the daily-updated synoptic map for 2019 June 6 (about one Carrington-rotation perid before the eclipse).
(click here to enlarge)
Last update : 2019 June 20 (text),
June 30 (plots)
K. Hayashi