Prediction of the solar corona on August 21, 2017.
Prediction with low-resolution Daily-update MHD simulations
From daily-updated MHD simulations, we can make several types of prediction that can be compared with the actual eclipses seen from the ground.
One daily simulation with 0.15 million grids takes usually two hours on an 8-core node.
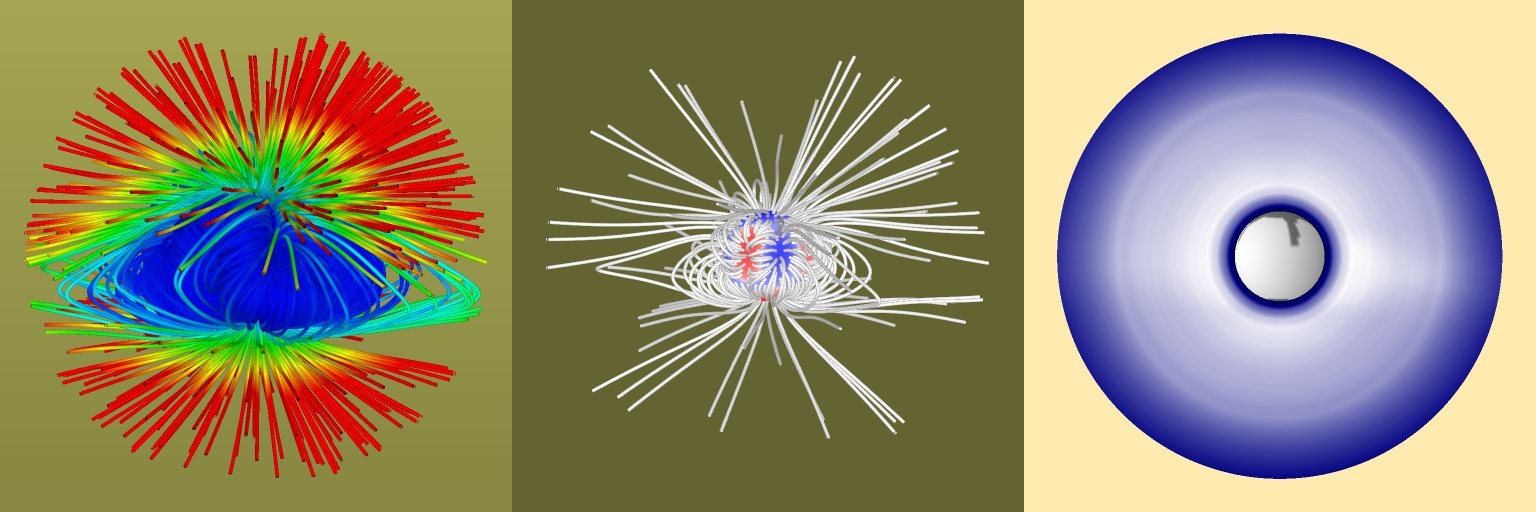
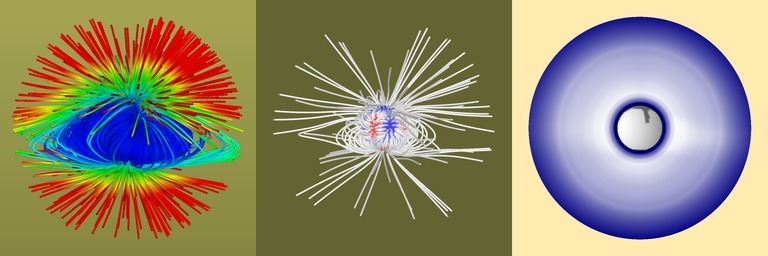
In the figure below, from left to right,
coronal magnetic field lines colored with plasma speed (within 2.5 Rs),
field lines (within 5 Rs) and photospheric magnetic field,
base of open-field regions (coronal holes) and brightness of coronal streamers are shown.
an mpeg movie combining plots made from 2017 June 23.
The rightmost plot (coronal brightness and base of open-field region) can be straightforwardly compared with other observations.
Coronal brightness plotted here is synthesized as the plasma density (multiplied by apparent size of the Sun seen from each point) integrated along line of sight in three-dimensional data from near-real-time MHD simulation, and normalized with Newkirk filter function.
The view point is set at the position of the Earth on August 21, 2017 (approximately CR2194, 280 degrees longitude, and 7 degrees north from solar equator).
These plots are updated regularly and daily around 11:30AM PST, after our daily coronal MHD simulation is completed.
With a medium-resolution MHD simulation
using the synoptic map made on 2017 August 3.
This simulation, with a half million (72x128x64) grids, took about a day on an 8-core node.

With PFSS model
an mpeg movie.
Last update (text) : 2017 August 8.
Daily updates started on 2017 June 22.
K. Hayashi