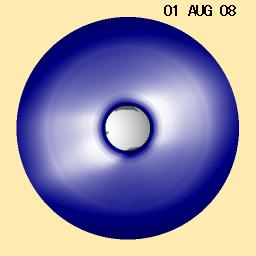
surface : open/closed
top/bot. : north/south of sky
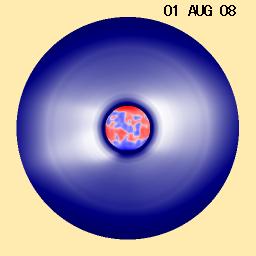
surface : Br (red:-,blue:+)
top/bot. : solar north/south
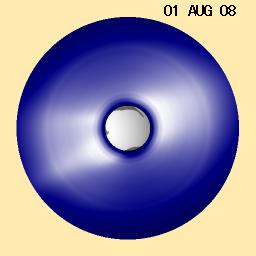
surface : open/closed top/bot. : north/south of sky |
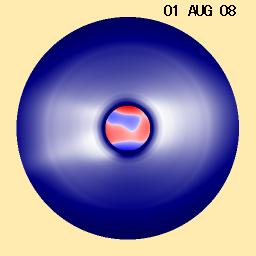
surface : Br (red:-,blue:+) top/bot. : solar north/south |
 surface : open/closed top/bot. : north/south of sky |
 surface : Br (red:-,blue:+) top/bot. : solar north/south |
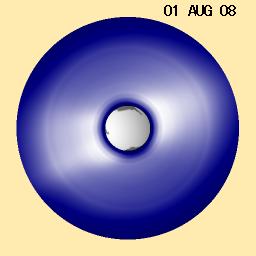 surface : open/closed top/bot. : north/south of sky |
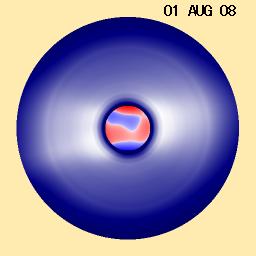 surface : Br (red:-,blue:+) top/bot. : solar north/south |