Prediction of the solar coronal brightness,
to be seen at the total solar eclipse on November 13, 2012.
Plots of MHD run with a bit higher spatial resolution:
 Date of last observation used in making the daily-updated synoptic map:
Nov. 5 12:12 UT, 2012.
Date of the MHD simulation run:
Nov. 5 23:25 PST, 2012.
Coronal brightness plotted here are LoS-integrated plasma density of near-real-time MHD simulation of the solar corona,
normalized with Newkirk filter function.
MHD data is from the daily real-time coronal MHD simulation
using the daily-updated magnetic field data by SDO/HMI.
The plots below were updated
Tue Nov 13 21:45:02 UTC 2012
It is really challenging to make good prediction of the solar corona at the forthcoming eclipse:
The field strength is now overall weak at quiet Sun and high-latitude and polar regions, thus the global structure of the solar corona seems more sensitive to the small-scale dynamical variations of the magnetic field at active regions than it used to be before.
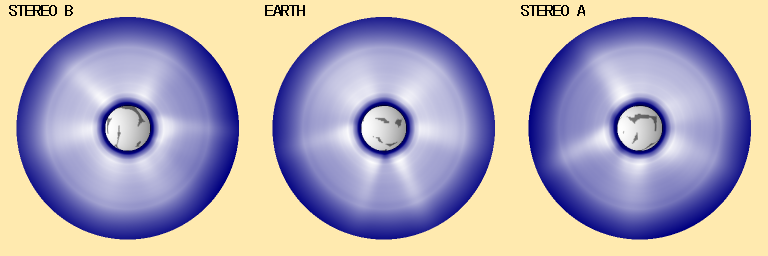
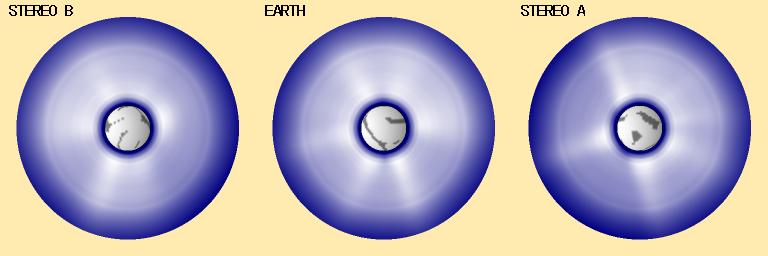 MHD simulation : coronal brightness seen from positions of STEREO-B, Earth, and STEREO-A at 22UT 2012 Nov 13, (solar north, up).
 MHD simulation : coronal brightness and field lines, seen from the Earth at 22UT 2012 Nov 13, with P-angle adjusted (celestial north, up)
 PFSS calculation : field lines, coronal holes, and HCS seen from the Earth at 22UT 2012 Nov 13 (solar north, up).
texts updated on Nov. 7, 2012
plots being updated daily, until Nov. 14 or so.
K. Hayashi