We developed a time-dependent three-dimensional MHD simulation model for solar active regions [c.f. Hayashi et al., 2018]. In our new model, the simulated system is driven with the electric field specified on and around the bottom boundary surface, whose curl fully matches with the temporal variations of the observed solar photospheric magnetic field vectors. This feature allows use to simulate the solar AR system that fully matches the capriciously varying actual solar photospheric magnetic field and satisfies the divergence-free condition of the magnetic field, all through simulation runs.
|
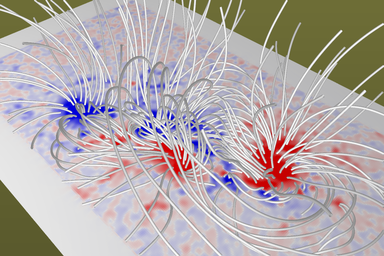
Field lines in the simulated solar active region:
The colors on the bottom boundary surface are the Bz component of the observed magnetic field. In our model, all three components of the bottom boundary magnetic field evolves, matching the observed three-component HMI vector magnetic field data all through the span of simulated time. As the horizontal components are specified (constrained), the magnetic field lines exhibit more non-potential nonlinear features than would be in the case with unconstrained horizontal components. |
The solar corona is sub-Alfvénic, and the time-relaxation simulation with time-dependent MHD code is probably a unique method to solve the nonlinear MHD equations and obtain the general three-dimensional solution of the solar corona. To specify the time of interest and to obtain realistic solution, the measurement-based data is used as the boundary value. After giving three-dimensional initial value matching the boundary data, we can start the time-relaxation simulation to obtain the sub/trans-Alfvénic solar corona. It must be mentioned that there remain lots of assumptions in model descriptions. These assumptions would be in future replaced with measurement-based and theoretical descriptions.
We have developed the three-dimensional magnetohydrodynamics (MHD) simulation code based on the strategies, such as MUSCL (of 3rd-order, van Leer), and TVD (Roe-type linearized Riemann solver). [c.f. Hayashi, 2005 ; Hayashi et al., 2006]. As the quick version, the Lax-Friedrichs method is often used for provisional studies.
The boundary treatment on the inner boundary surface is a challenge: The boundary is sub-Alfvénic, thus the numerical inconsistency will arise unless the adequate treatment is imposed there. The method of characteristics [e.g. Nakagawa and Steinolfson, 1976; Nakagawa, Wu and Han, 1978; Nakagawa, 1981] and the projected normal characteristic method [Wu and Wang, 1987; Han et al., 1988] were applied to MHD simulations for solar corona. With these boundary treatments, we can determine temporal evolution of MHD variables satisfying both characteristic nature of the basic MHD equations and imposed boundary constraints. We developed modified versions of the projected normal characteristics method for our purposes [Hayashi, 2005].
|
The closed field lines in the solar corona simulated with the measurement-based magnetic field data:
The colors on the sphere represent the polarity of the measurement-based magnetic field data imposed as the boundary value; the blue and red represent the positive (outward) and negative (toward the Sun) magnetic field polarity, respectively. Field lines in some volume are not drawn so that field lines inside the closed-field regions can be well seen. A movie (mp4) and another one (mp4) show the coronal field structure, including the connectivity between the two polarities and how it varies with respect to the solar longitude. |
|
 |
The field lines in the solar corona and the density at the base of corona:
The contrasts in density and other plasma parameters can be retrieved by using the boundary treatment based on the projected normal characteristic method [c.f. Hayashi, ApJS 2005]. |
|
This VRML (Virtual Reality Modeling Language; gzipped, 148kB) shows the coronal magnetic field lines, and another one (gzipped, 552kB) does both field lines and magnetically neutral surfaces (zero-Br contour surfaces). |
The time-dependent MHD codes can be applied for numerically tracing the time evolution of the eruptive events such as flare and CME, in the solar corona and solar wind. In many simulation studies, the time-relaxed state of the solar corona is first prepared then some numerical perturbation is given to mimic the eruptive event and initiate the disturbance.
|
The left plot and a movie (mp4) show a test case of eruptive event; particles are traced in time dependent MHD systems, starting from the site at which a "fireball" with thermal energy comparable with that of an M-class flare is given. |
The time-dependent MHD codes can be applied for numerically tracing the interplanetary responses to the coronal eruptive events, as flare and CME. Similarly to the coronal simulations, in many studies, the time-relaxed state of the solar wind is first prepared then some numerical perturbation is given to initiate the interplanetary disturbances.
|
The left plot is a snap shot of the interplanetary propagation of the CME-origin magnetic loop. Background solar wind speed is given from the WSA model and shown with false colors (blue-green-red) on the inner boundary sphere. The inner boundary sphere is at the heliocentric distance of 50 Rs, in this demo case. |
The MHD codes can be applied for the regions distant from the Sun. Time-dependent codes are generally used, and the radial-increment (non-time dependent) version of MHD code [c.f. Hayashi,K. et al., 2003 JGR] can be used when the interest is on the steady state of the super-Alfvénic solar wind in the inner heliosphere at r < 5 AU or so. The radial-increment method is inevitably more numerically diffusive (or erroneous) than the time-dependent version. But, it runs much faster and thus needs less computational resources, and yields reasonably accurate solutions. These features help do the model calculations needing iteratively calculation of the solar-wind MHD variables. I have developed both radius-increment and time-dependent versions.
To start the simulations, we always have to set the boundary values. One good set of the boundary solar wind variables is the MHD solution obtained by the sub/trans-Alfvénic MHD simulation.
The MHD version and other versions of computer assisted tomography (CAT) analysis for the interplanetary scintillation (IPS) measurement [c.f. Jackson,V.B. et al., 1998 JGR ; Kojima,M. et al., 1998 JGR ; Hayashi,K. et al., 2003 JGR] can provide the "measurement-based" boundary variables of solar wind in the inner heliosphere.
In the outer part of solar wind, the effects of the solar rotation becomes dominant, and the fast and slow solar wind starting from different solar regions at different times collide and interact each other. The MHD simulations can solve this nonlinear interaction process. The MHD allow theoretical extension of the solar wind solution outward up to several or tens AUs. It must be noted that the pickup ion (interstellar-origin materials ionized/energized through collisions with solar wind particles and/or solar (E)UV) should be taken into account for better simulations / determination of interplanetary space, especially in regions beyond 4 or 5 AUs [e.g. Usmanov and Goldstein, 2006].
|
Cross-section view of a three-dimensional simulated solar wind structure
on the solar equatorial plane (up to 2000 solar radii) :
This plot depicts the formation of steep gradients or discontinuities at the co-rotating interaction regions (CIR) between faster wind (drawn with green) and slower one (yellow and orange) in the simulated spiral structure of the solar wind. |
|
Magnetically neutral region, or heliospheric current sheet (HCS),
in the simulated region, from 30 solar radii to 2030 solar radii (∼9.4AU):
The HCS is the sheet, or thin heliospheric layer, where global magnetic field with different directions (toward the Sun or outward) contacts. Because the Sun rotates, the spiral structures forms. This (rose-like) spiral surface is the contour surface of Br = 0 that well represents the HCS. The red (blue) surface is such that the magnetic field at that side direct toward (outward from) the Sun. |
|
The HCS in the region (from 50 solar radii) up to 10050 solar radii (∼47AU):
For drawing the HCS at such distant regions, the contour surface of the Bφ = 0 is a convenient proxy of HCS rather than Br is. Because it takes about one solar rotation period for the solar wind of typical speed to reach several ∼ 10 AU, the HCS apparently rotates 6 times in the regions drawn. The simulated structure gradually and continuously evolves as the consequences of the nonlinear MHD interaction. |
The differences in colors (blue/red) between the two HCS plots above are due to the differences in the input data given on the inner boundary: The dominant magnetic field polarity varies in accordance with what people call the 11-year solar cycle, and the two plots above are apart in the period simulated.