There are so many models and solutions proposed by Parker, E. N.. Here, the word "Parker solution" or "Parker model" is meant the steady state solution of the spherically symmetric trans-sonic polytrope plasma flowing outward radially from a non-rotating star. This solution pretty well depicts basic features of the solar wind. By taking the solar rotation and magnetic field into account, we will reach other models [e.g. Weber and Davis, 1967 ; Sakurai, 1985].

|
The Parker solution family class, v(r), is expressed as contour curves of H(r,v),
the total specific energy
(kinetic energy, thermal enthalpy, and gravitational potential per unit mass),
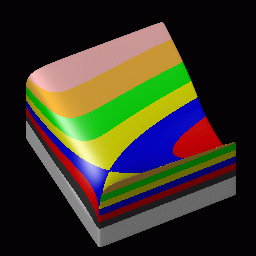
 . .The parameters with subscript 0 stand for values taken at a reference point, generally the critical (trans-sonic) point. The left plot (movie) is a bird-eye-view of H(r,v) drawn in x-y-z space; x axis is for the heliocentric distance (radius), y is for the flow speed, and z and the colors are for the value of H that is offset and then rescaled with logarithm for display purpose. |
There are two key parameters to determine the system;
the specific heat ratio (γ) and the typical temperature (T0).
The index γ characterizes the relationship between density and pressure (or temperature),
taking over the equation of state.
It is frequently chosen to be 1 or numbers slightly greater than 1,
so that the polytrope approximation will mimic near-isothermal high-heat conduction case
(under the absence of the heat conduction and other extra processes,
this index must be 5/3, equal to one for the monatomic or proton or electron).
Here it is set to be 1.05.
Given the solar mass and gravity constant,
the typical temperature is another key parameter
generally defined at the critical trans-sonic point.
1 MK is often chosen, for this number yields reasonably good consequences
at wide range of regions from solar surface, corona to interplanetary space.
The plot above contains all possible Parker solution types.
Among them, the solar wind of the trans-sonic outward flow
is expressed by the special one running, in the drawing above,
from left-bottom (sub-sonic) to critical point (trans-sonic)
to the upper-right (super-sonic);
the critical point is at the x-point dividing yellow and blue areas,
and the integration constant H0 at the right hand side
of the total enthalpy equation above has to be zero.
Another solution line that passes the critical point but
runs from upper-left (super-sonic near the Sun) to the x-point to bottom-right
(sub-sonic regime at region distant from the Sun)
is of few meanings for the solar wind, though,
there are lots of meanings for other systems like accretion disc.
coming soon ....
coming soon ....


